
The default curve
Two different kinds of number live on this page. One is ours: the shape of our own agent work, read across hundreds of jobs on our own repository. The other is yours, and we do not have it — it lives in your own runs, behind your own sign-in.
Every curve here is drawn when you open the page, from the committed receipt public/backup/default-curve.json; the record it was computed from stays on our machine, so the numbers change only when that receipt is rewritten, and the time it was written is printed under the curve.
RIGHT BANK · the underwriter's lead graph
The semantic vega, over the whole sealed history
Semantic vegaUNMEASURED public/.well-known/semantic-vega.json is not readable at this render (ENOENT)n=0
UNMEASURED — public/.well-known/semantic-vega.json is not readable at this render (ENOENT).
seal UNMEASURED — data/pmu/measure-history.ndjson is not readable at this render
+The Default Curve — the macro reference model46% less in total for the same task mix · p 0.005
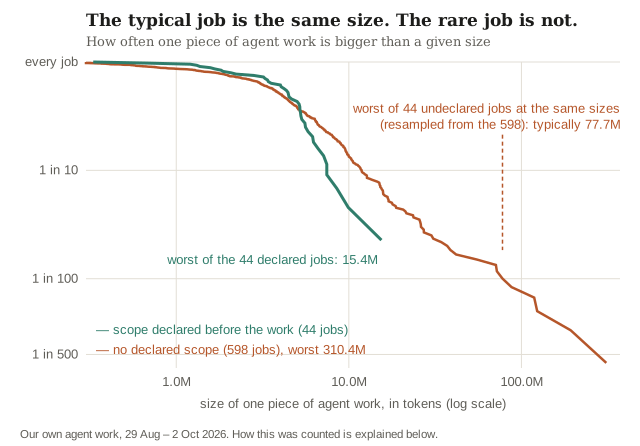
The expected distribution across our own work: how often one piece of agent work is bigger than a given size, read from 44 jobs run against a scope declared before they started and 598 jobs that carried none, 29 Aug – 2 Oct 2026.
For the same mix of tasks, the declared jobs used 46% less in total (p 0.005). The worst declared job ran 15.4M; drawing 44 jobs from the undeclared 598 at the same sizes, 20,000 times, the worst is typically 77.7M. In the undeclared work the worst 5% of jobs carry 39% of all tokens; in the declared work, 17%.
+Tokens in one task — the tail an underwriter prices46 % less for the same task mix · p 0.005 · n 642
Each curve is the share of tasks that used more than a given number of tokens, log-log: 44 tasks run against a scope declared before they started, 598 without one, 29 Aug – 2 Oct 2026. The typical task is the median; the price of cover is set by the rare one at the far right, where a straight fall is a fat tail.
scope declared before the task · n 44 no declared scope · n 598 grey band: the null
Tokens in one task, same task mix46 % fewer with a declared scopen=642
How often one task uses more than a given number of tokens: 44 tasks run against a scope declared before they started, 598 without one, 29 Aug – 2 Oct 2026. The typical task is the median; the price of cover is set by the rare one at the far right.
One task is a prompt to the change it committed, or one unattended run of a written spec row to the commit it graded; its tokens are the model's input plus cache reads and writes, summed over every model call in it. The axes are log-log: a straight fall is a fat tail.
That declaring a scope caused the gap: the declared tasks were not randomised, and the task mix differs between the two arms.
What any single future task will cost — this is the record's own tail over 29 Aug – 2 Oct, not a forecast.
Recompute it yourself: node scripts/vna/token-tail.mjs --json.
Re-run the snapshot: if the permutation p (now 0.005) rises above 0.05, or the declared worst-5 % share is no longer below the undeclared one, the separation is gone.
- For the same task mix, the declared tasks used 46 % less in total (p 0.005).
- The worst 5 % of undeclared tasks carry 39 % of all their tokens, against 17 % declared.
- Worst task: 15.4M declared, 310.4M undeclared.
Read from public/backup/default-curve.json, the one receipt every statement of these figures is read from. Recompute: node scripts/vna/token-tail.mjs --json.
Receipt written from the record ; this curve drawn from it .
Download the actuarial dataset (CSV) · JSON — one row per task: arm, complexity decile, total tokens. With the seed, the 20,000 redraws and the definitions, the reference scripts (Python · R) recompute p, the worst-5% shares and the grey band from the file alone. Arm sha256: declared a555fcd4a2e7f0e1b12fbf9f3fb44a7b9857eed77def48725d475ef0b9cf9912 · undeclared 104b188c139c3348a2a0175d10cc09e95b54b967c1402e0a8e8fb235a35c3b6c.
You don't have to run anything. View the run: a third party (GitHub Actions, in the public repository) recomputes this figure from the published dataset on a schedule and attaches its log, the sha256 of every input and a signed attestation of the run. Or run it yourself, on your own machine, with the dataset and the Python script above: python3 actuarial-dataset.py actuarial-dataset.csv. The short address for this page is https://thetadriven.com/curve.
Live backup query: asking /api/backup/fat-tail for the newest shared backup's reading.
+The graphs that carry the claimfour, each drawn off the receipt it names
Each is drawn from the receipt it names, at the same request as the curve above.
+The worst task in each armworst 310.4M undeclared · 15.4M declared
Drawn to one scale. The typical task (the tick on each bar) is about the same size in both arms; the largest is not.
Typical task 4.5M declared, 4.1M undeclared. Worst task 15.4M declared, 310.4M undeclared.
+How much the worst 5 % of tasks carry39 % undeclared · 17 % declared
Each bar is all the tokens in one arm. The filled part is what its largest 5 % of tasks used.
In the undeclared work the worst 5 % of tasks carry 39 % of all its tokens; in the declared work, 17 %.
+The trial that tests it: paired tasks against its barUNMEASURED
UNMEASURED — data/vna/reflex-trial.json is kept on the machine that runs the trial and is not on this server.
+What a backup carries of our record7 of 8 tapes online
Per tape: the share of the rows on our machine that the newest posted backup holds online, where anyone with the link can recompute from them.
Newest posted backup b7c02be927, 2026-10-04; its manifest reads chain_verified false, so the chain across backups is not yet checked. Tapes kept on this machine only are drawn at zero. The full reading: /backup/cost.
+The Measurements — your own ground truthyours, behind your own sign-in
The curve above is ours, not yours. Your measurements are your own micro ground truth: your own re-runnable telemetry, read from your own runs and extracted via your own sign-in — never ours to read on your behalf.
Sign in to read your own adherence against this curve.
+How this was countedone job, prompt to commit · tokens, not cost
One job is one unit of agent work, from the prompt to the change it committed, on our own repository. Tokens are the model's input plus cache reads and writes, counted once per model call: they measure how much work a job did, not what it cost and not any loss. The scope is written down before the work; nothing enforces it, so a smaller tail on the declared side is not built in by a cap. The 44 declared jobs were not randomised, and 35 of them ran unattended rather than in a live session — route and scope are therefore confounded.
Recompute it yourself: node scripts/vna/token-tail.mjs --json.
+What this page is sufficient forand what it is not
Sufficient for: the shape of how large one piece of agent work gets, with and without a scope declared before it started, on our own work. NOT sufficient for: a loss figure (tokens measure work, not loss), a randomised comparison (most of the declared jobs ran unattended, so route and scope are confounded), or any organisation other than ours; whether the work was good is undecidable (Rice, 1953).
Reading a backup someone handed you: how to read it without us · Uploading your own: /backup